💡 Imagine you are a detective...
A crime has occurred. How do you catch the culprit?
You examine "evidence" — footprints, fingerprints, security cameras
Forex trading works the same way!
Charts = Evidence showing where the price has been and what it has done
And from that evidence, we can "predict" where the price will likely go next 🔍
What is a Chart?
A Chart is a visual representation of past price movements. It is like a "timeline" that records everything that has happened to the price.
From a chart, we can see trends (is the price going up or down?),patterns (what signals are there?), and key levels (where does price tend to reverse?)
Types of Charts
There are 3 main chart types used in Forex:
1. Line Chart
- A single line connecting closing prices over time
- Easy to read, shows trends clearly
- Limited information, does not show details
2. Bar Chart
- Shows Open, High, Low, Close (OHLC)
- Complete information but harder to read
- Popular in American markets
3. Candlestick Chart ⭐
- Shows OHLC like Bar charts but easier to read
- The most popular chart type in Forex trading
- Has patterns that provide trading signals
💡 Recommended: Focus on learning Candlestick Chartsas they are the most widely used and have patterns that aid analysis
Understanding Candlesticks
Each candlestick consists of 4 parts:
- Open — The price when the time period began
- Close — The price when the time period ended
- High — The highest price during that period
- Low — The lowest price during that period
Parts of a Candlestick
- Body — The area between Open and Close
- Upper Shadow/Wick — The line from the Body to the High
- Lower Shadow/Wick — The line from the Body to the Low
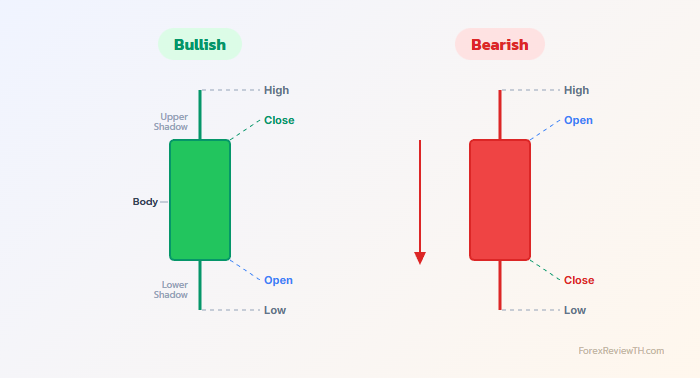
🟢 Bullish Candlestick (Upward)
- Close is higher than Open
- Usually displayed in green or white
- Shows that buyers won during that period
🔴 Bearish Candlestick (Downward)
- Close is lower than Open
- Usually displayed in red or black
- Shows that sellers won during that period
Candlestick Patterns You Should Know
Bullish Reversal Patterns
- Hammer — Small body, long lower wick, short/no upper wick → may reverse upward
- Morning Star — 3 candles: long red + small + long green → strong reversal signal
- Bullish Engulfing — Green candle swallows the previous red candle → reversal signal
Bearish Reversal Patterns
- Shooting Star — Small body, long upper wick, short/no lower wick → may reverse downward
- Evening Star — 3 candles: long green + small + long red → strong reversal signal
- Bearish Engulfing — Red candle swallows the previous green candle → reversal signal
Indecision Patterns
- Doji — Open = Close, almost no body → market is indecisive, may reverse
- Spinning Top — Small body, roughly equal upper and lower wicks → market is undecided
⚠️ Important: Candlestick patterns alone are not enough!
You must also consider context — where is it in the trend? Is there support/resistance nearby?
You must also consider context — where is it in the trend? Is there support/resistance nearby?
What is a Timeframe?
A Timeframe is the time period each candlestick represents. If you use the 1-hour timeframe (H1), each candlestick represents 1 hour of price action.
Common Timeframes
| Timeframe | Name | Best for |
|---|---|---|
| M1, M5, M15 | Minutes | Scalping (very short-term trading) |
| M30, H1 | 30 min - 1 hour | Day Trading |
| H4 | 4 hours | Swing Trading |
| D1 | Daily | Swing / Position Trading |
| W1, MN | Weekly / Monthly | Position Trading, big picture view |
💡 For beginners: Start with H1 or H4
Not too fast, gives you time to think, and signals tend to be more reliable than smaller timeframes
Not too fast, gives you time to think, and signals tend to be more reliable than smaller timeframes
Multiple Timeframe Analysis
Professional traders often look at multiple timeframes simultaneously:
- Higher timeframe (D1, H4) — Identify the main trend
- Middle timeframe (H1) — Find entry points
- Lower timeframe (M15) — Fine-tune precise entries
💡 Simple rule: Trade in the direction of the higher timeframe
If D1 is trending up → Look for Buy entries on H1
If D1 is trending down → Look for Sell entries on H1
If D1 is trending up → Look for Buy entries on H1
If D1 is trending down → Look for Sell entries on H1
Summary
- Candlestick is the most popular chart type showing Open, High, Low, Close
- Green candle = Bullish (up), Red candle = Bearish (down)
- Candlestick patterns help identify potential reversals
- Timeframe tells you what time period each candle represents
- Beginners should use H1-H4 and practice multiple timeframe analysis
🎯 Next Lesson: We will learn the basics of Technical Analysis — Support/Resistance, Trendlines, and key Indicators